JProfiler logo

JProfiler 16.1.1

  • User Rating:
    ★★★★★
    ★★★★★
    0.0 0Votes
  • Requirements:
    Windows
  • Version: 16.1.1
  • Latest updated: 1 week ago
  • License: Free Trial  
  • Publisher: EJ Technologies
  • Size: 180 MB
× app stores

JProfiler is a professional profiling tool designed for Java applications, helping developers identify performance bottlenecks and optimize code execution. It combines deep analysis capabilities with a user-friendly interface, making it suitable for both experienced developers and teams working on enterprise applications. During my experience with it, I found that JProfiler presents complex profiling information in an organized and approachable manner.

Features of JProfiler

  • Dynamic profiling for Java applications
  • Straightforward session configuration
  • Third-party integrations for quick setup
  • Natural and easy-to-understand presentation of profiling data
  • JDBC profiling with timeline and activity views
  • JPA and Hibernate profiling support
  • NoSQL database probes for MongoDB, Cassandra, and HBase
  • Hot spots view for identifying slow database statements
  • Telemetry views and individual event analysis
  • Extensive Java Enterprise Edition (JEE) support
  • Request-based call tree analysis
  • Semantic profiling layer for JDBC, JPA/Hibernate, JMS, and JNDI
  • High-level profiling information for RMI calls, files, sockets, and processes
  • Support for web services, JSP/Servlets, and JMS
  • Custom probes configurable on the fly
  • Compatible with Windows 11, Windows 10, and Windows Server 2025, 2022, 2019, and 2016

User Experience

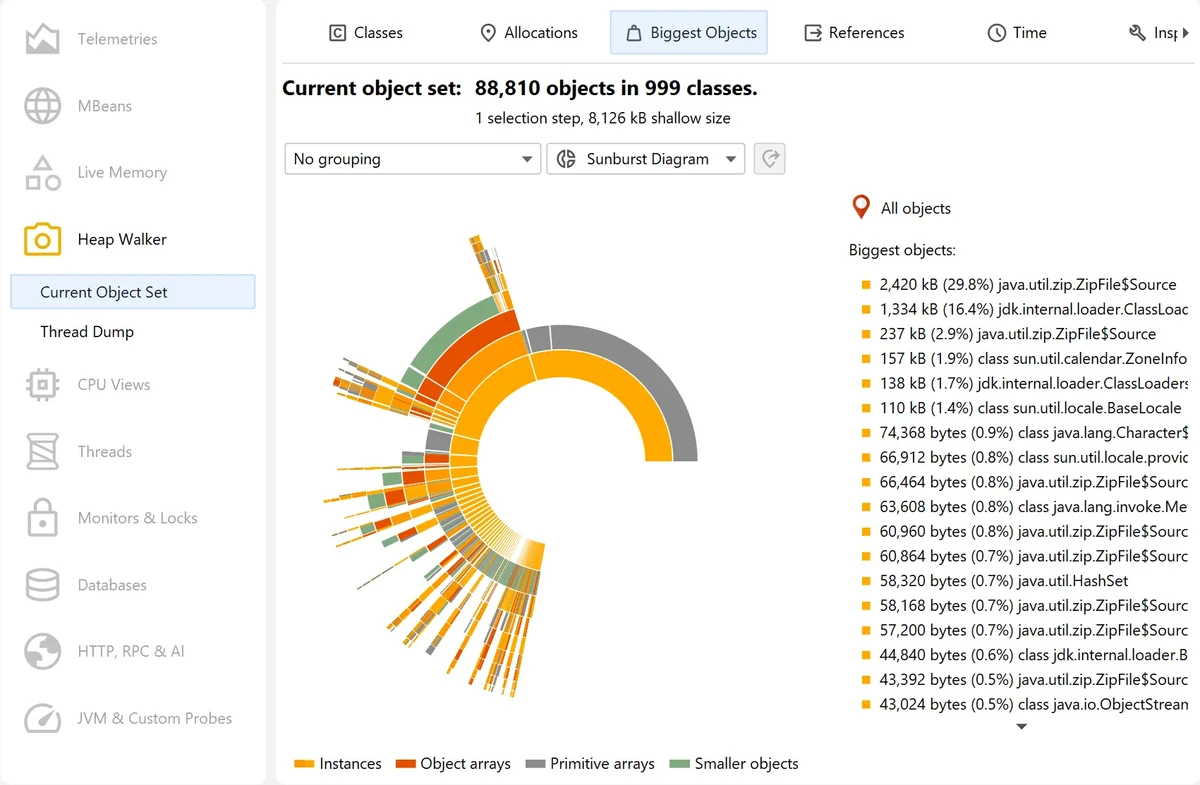
After working with JProfiler, one of the first things I noticed was how approachable the setup process is. Creating profiling sessions is straightforward, and the interface organizes large amounts of information without feeling overwhelming. Database profiling stands out as one of its strongest areas. The JDBC timeline view and hot spots analysis make it much easier to understand where performance issues originate. Rather than simply showing raw metrics, JProfiler helps connect slow queries to the code responsible for them.

The support for Java Enterprise Edition environments is equally impressive. Breaking down call trees by components and request URIs provides valuable insight into how enterprise applications behave under load. I also appreciated the semantic layer added on top of low-level profiling data, making the results easier to interpret. Advanced users will benefit from the numerous probes that cover files, sockets, processes, and remote method calls. Custom probes can also be configured dynamically, providing additional flexibility when analyzing specific application components.

Despite the depth of information available, the interface remains surprisingly easy to navigate, allowing developers to focus on solving performance problems instead of learning the tool itself.

Who Should Use JProfiler?

  • Java developers optimizing application performance
  • Enterprise development teams working with JEE applications
  • Developers troubleshooting JDBC and JPA performance issues
  • Teams using MongoDB, Cassandra, or HBase databases
  • Professionals requiring detailed profiling and event tracing
  • Software engineers seeking deep insights into resource usage

Conclusion

JProfiler is a highly capable performance analysis tool that balances depth with usability. Its database profiling features, enterprise Java support, and extensive monitoring capabilities make it an excellent choice for developers who need to diagnose bottlenecks and optimize application performance. If you're building or maintaining Java applications and want detailed insight into how they behave, JProfiler is a tool worth considering.

Pros & Cons

Pros

  • Powerful and detailed Java profiling capabilities
  • Easy-to-use interface and session configuration
  • Strong JDBC and database profiling tools
  • Excellent Java Enterprise Edition support
  • High-level insights into files, sockets, and processes
  • Flexible custom probes
  • Helpful telemetry and hot spots views
  • Good third-party integration support

Cons

  • Advanced profiling data may require experience to interpret fully
  • Primarily targeted at Java developers and enterprise environments
  • Rich feature set can feel overwhelming for casual users

Frequently Asked Questions

What is JProfiler used for?

JProfiler is a Java profiling tool used to analyze application performance, identify bottlenecks, and optimize resource usage.

Does JProfiler support database profiling?

Yes. It includes profiling support for JDBC, JPA/Hibernate, and NoSQL databases such as MongoDB, Cassandra, and HBase.

Can JProfiler analyze Java Enterprise Edition applications?

Yes. JProfiler provides extensive JEE support with request-based call trees and semantic profiling information.

Does JProfiler support custom probes?

Yes. Users can configure custom probes dynamically to monitor specific application components.

What additional resources can JProfiler monitor?

Besides CPU and database activity, JProfiler can analyze files, sockets, processes, RMI calls, web services, JMS, and JNDI activity.

Is JProfiler beginner-friendly?

Yes. While it offers advanced capabilities, the interface and session configuration process are designed to be straightforward and easy to understand.

Which Windows versions are supported?

JProfiler supports Windows 11, Windows 10, and Windows Server 2025, 2022, 2019, and 2016.

Recommended apps [Freeware]:
  • Autoruns 14.30 Autoruns logo a Windows startup manager that reveals and controls all autostart programs, services, drivers, and registry entries
  • RustDesk 1.4.8 RustDesk logo open-source remote desktop solution with self-hosting, cross-platform support, and customizable remote access tools
  • Ventoy 1.1.16 + LiveCD Ventoy logo create bootable USB drives and boot directly from ISO files without extraction or reformatting
  • Q-Dir 12.69 Q-Dir logo a lightweight quad-pane file manager for Windows, offering fast navigation, drag-and-drop, and portable access
  • Youtube Downloader HD 5.9.9.13 Youtube Downloader HD logo a simple Windows tool for downloading and converting YouTube videos in HD formats
  • FTP Rush 3.6.7 FTP Rush logo cross-platform FTP/SFTP and cloud storage client supporting server-to-server transfers, scripting, and multi-protocol file management
Recommended apps [Shareware]:
  • Fast Video Cataloger 10.0.4.0 Fast Video Cataloger logo Organize, search, browse, and manage large video collections with Fast Video Cataloger for Windows
  • Classroom Spy Pro 5.6.6 Classroom Spy Pro logo Monitor, control, and manage student computers remotely with Classroom Spy Pro for Windows classrooms
  • Centurion Setup 51.0 Centurion Setup logo Windows installer builder that creates compressed, self-contained executables with multilingual support
  • EaseUS Data Recovery Wizard 20.5.0 EaseUS Data Recovery Wizard logo Recover deleted or lost files with EaseUS Data Recovery Wizard using quick and deep scans for hard drives
  • DiskBoss 16.9.18 DiskBoss logo powerful Windows file management tool for disk analysis, duplicate cleanup, file synchronization, and data migration
  • Fast Video Cutter Joiner 7.1.4.0 Fast Video Cutter Joiner logo a lightweight video editing tool for quickly cutting, trimming, and joining videos